
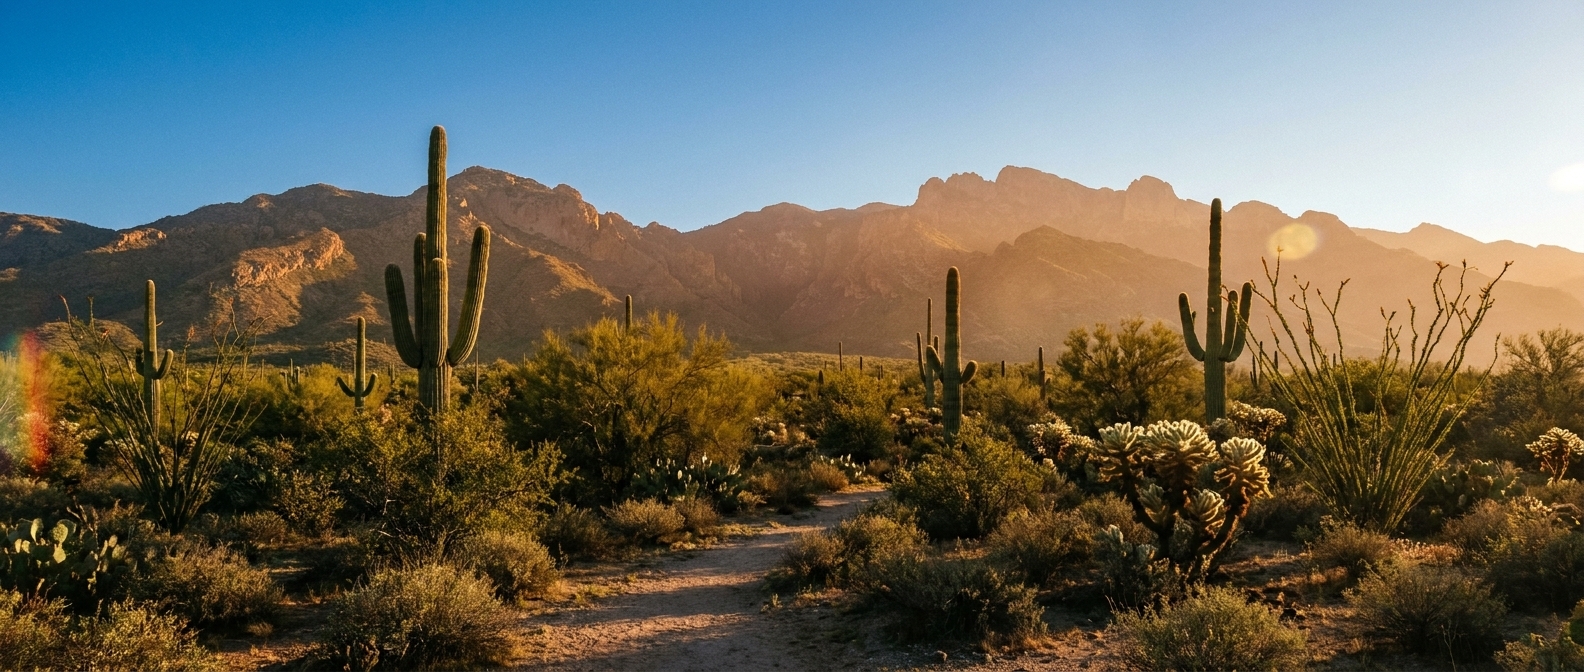
Beyond the Stay — Tucson, Arizona
Guest Spend Beyond the Stay · Tucson, Arizona
Market: Tucson / Metro Tucson
Core Submarkets: Downtown–Fourth Avenue–University | Catalina Foothills–Sabino Canyon | Saguaro East–Tanque Verde | Tucson Mountain–Starr Pass–Saguaro West
Data Vintage: 2018 compatible spend proxy; 2024 visitor/economic context; 2025 quantified Gem Show impact; current pricing and operator offerings checked August 19, 2026
Market Snapshot
For every $1 travelers spend on accommodations, they spend approximately $1.57 beyond the stay.
Proxy basis: Tucson & Southern Region, domestic overnight travel parties, 2018. This is the closest compatible same-source per-party spending split located for the standardized Beyond the Stay Ratio and per-100-stay benchmark. It covers a broader geography than the City of Tucson, so the $246 accommodation spend, $387 Beyond the Stay Spend and 1.57x ratio are presented as a regional proxy—not as exact 2026 Tucson city averages. The proxy is used because lodging and non-lodging categories share the same geography, traveler population, period and reporting basis. Newer 2024 sources provide stronger current market-scale and traveler-profile context, but do not provide the same compatible per-travel-party accommodation/non-accommodation split. Calculation: $387 ÷ $246 = 1.57x.
Market Context & Benchmark Basis
Current market context: Pima County recorded approximately $3.5 billion in direct travel spending in 2024. Across the five-county Tucson & Southern Region, county totals sum to roughly $4.26 billion, led overwhelmingly by Pima County. Arizona Office of Tourism also reported about 6.1 million domestic overnight visits to the Tucson & Southern Region in 2024, while cautioning that regional visitation can overlap when one trip touches more than one Arizona region.
The 2024 visitor profile reinforces that Tucson operates as more than a single-purpose resort market. Visiting friends or relatives accounted for 48.5% of regional overnight person-trips, while touring (11.0%), special events (8.7%), outdoors (7.3%), business-leisure (6.4%), city trips (4.0%), casino trips (3.8%), conferences/conventions (2.1%) and golf trips (1.1%) created multiple distinct reasons for travelers to spend beyond lodging.
Benchmark-basis note: the newer 2024 sources are intentionally not substituted into the ratio. They report aggregate county/regional spending and person-trip behavior, rather than a compatible lodging-versus-non-lodging spend split per travel party. Combining those newer aggregates with the 2018 per-party lodging value would mix populations and units. The 2018 regional study therefore remains the standardized spend benchmark, while 2024–2026 evidence is used to describe current scale, behavior, pricing, seasonality and operator activity.
1. Guest Spending Beyond Accommodations
Tucson & Southern Region proxy — average domestic overnight travel party, 2018:
Dining was the largest non-lodging category in the compatible benchmark at $158 per travel party, or about 40.8% of Beyond the Stay Spend. Destination transportation represented $89 (23.0%), retail $75 (19.4%), and recreation / sightseeing / entertainment $65 (16.8%). Together, non-accommodation categories accounted for $387 of the $633 total trip spend—about 61.1% of the modeled travel-party wallet.
The breadth of the spend mix matters. Tucson does not depend on one ancillary category to create an operator opportunity: food, movement around the destination, shopping and paid recreation all sit inside the same spend pool. That supports a portfolio approach in which a hospitality operator can facilitate several smaller, high-frequency purchases alongside fewer premium experiences.
Important limitation: the $387 baseline is a 2018 nominal-dollar regional proxy. It should not be read as a current 2026 Tucson average spend estimate or inflation-adjusted forecast. Its role is to provide a compatible, transparent basis for the ratio and per-stay modeling. Current 2026 ticket examples elsewhere in this study are used to show what specific products cost today, not to re-price the 2018 spend basket.
2. What Travelers Actually Do
The 2024 Tucson & Southern Region visitor profile shows a market with several distinct trip drivers:
Hotels accounted for 34.1% of reported accommodations, resort hotels 9.2%, and rented homes / condos / apartments 6.7%. The same profile also reports 30.1% staying in the home of friends or relatives, underscoring that the regional visitor universe is broader than paid accommodation demand alone.
Interpretation: these 2024 shares are destination-demand context, not hotel or vacation-rental conversion benchmarks. They help identify the types of activities and trip purposes present in the market, but they do not establish the percentage of Tucson lodging guests who will buy a food tour, wellness day, desert activity or transportation product.
For operator strategy, the useful signal is the variety of trip motives. Touring, special events, outdoors and business-leisure all create different purchase moments: pre-arrival itinerary building, same-day activity booking, event transportation, premium dining, and recovery or wellness after outdoor recreation. That favors a curated marketplace that can change its offer mix by guest type and date rather than a single static upsell menu.
3. Highest-Potential Market-Specific Opportunities
The highest-potential offer stack is Tucson-specific: Sonoran food, desert access, astronomy, canyon experiences, wellness and event logistics. The local ticket spectrum also spans very different price points—from $15 Sabino Canyon rides to $75 food tours, $85 SkyNights, $29.95 Desert Museum admission and Miraval day packages starting at $389. This gives operators room to combine accessible add-ons with premium products instead of relying on a single average order value.
4. Opportunity by Submarket
Downtown, Fourth Avenue & University
Best-fit opportunities:
Food tours | Progressive dinners | Mural/history experiences | Nightlife | Event transportation | Curated retail
Market rationale:
Downtown, Fourth Avenue and Main Gate Square concentrate food, nightlife, murals, history and independent retail in a format that can be bundled into multi-stop urban experiences. Tucson Food Tours sells a four-hour Downtown product with 6–7 restaurant stops for $75, and it operates several neighborhood-specific routes, showing that the district itself is marketable as an itinerary rather than only as a list of restaurants. The facilitation opportunity here is high-frequency and itinerary-driven, and seasonal — the fuller walking schedule runs September through May, shifting summer products toward shorter walking distances, indoor stops and evening timing.
Catalina Foothills, Sabino Canyon & North Tucson
Best-fit opportunities:
Sabino Canyon | Resort wellness | Golf | Premium dining | Spa days | Guided hiking | Transportation
Market rationale:
Combines resort-style demand with direct access to premium wellness and outdoor recreation. Omni Tucson National's concierge can arrange horseback riding, desert Jeep rides, cattle drives, hot-air ballooning, shopping trips and mountain excursions; Miraval sells day access that packages resort amenities, wellness programming and credits for additional services. Sabino Canyon strengthens the submarket with a lower-ticket outdoor product (adult Crawler $15, night tours $15), while Mt. Lemmon adds a higher-friction but distinctive astronomy product requiring roughly 90–120 minutes of drive time.
Saguaro East & Tanque Verde
Best-fit opportunities:
Guided e-biking | Ranch riding | Guided hiking | Mountain biking | Sunset experiences | Nature interpretation
Market rationale:
Tucson's eastern desert edge supports a more active, guided-recreation offer. Tucson E-Bike Adventures operates a 2.5-hour guided Saguaro National Park East e-bike tour with bike, helmet, guide and park entrance included. Tanque Verde Ranch, bordering Saguaro National Park East and Coronado National Forest, surfaces trail riding, guided hikes, mountain biking, fishing, archery, Jeep/ATV experiences, yoga, spa and nature programming. This submarket is especially suited to advance booking because many products require equipment, guide capacity, timing, transportation or minimum physical readiness.
Tucson Mountain, Starr Pass & Saguaro West
Best-fit opportunities:
Arizona-Sonora Desert Museum | Golf | Spa | Guided hiking / biking | Sunset experiences | West-side transportation
Market rationale:
Tucson's western desert corridor combines one of the market's signature attractions with resort infrastructure. The Arizona-Sonora Desert Museum charges $29.95 for general adult admission and extends Saturday hours to 10:00 p.m. during June–August. JW Marriott Tucson Starr Pass surfaces on-site spa and golf and points guests toward hiking / mountain biking, Saguaro National Park and the Desert Museum. Accommodation-linked products here can combine resort-controlled spend—spa, golf, food and beverage—with nearby destination experiences, such as a morning hike followed by pool/spa recovery.
5. Event & Seasonal Opportunity
Tucson Gem, Mineral & Fossil Showcase
The 2025 Tucson Gem, Mineral & Fossil Showcase ran February 1–16 and generated an estimated $286 million in direct spending and $12.9 million in local tax revenue, across 6,709 vendors. This is the latest quantified Gem Show economic-impact benchmark verified for this report; it should not be mechanically treated as the measured impact of the 2026 event.
The 52-show structure is as important as the headline spend. The Gem Show is not a single-venue event: visitors and vendors move among many locations, which increases the practical value of airport transfers, inter-show transportation, route planning, dining coordination, stocked accommodations and flexible arrival/departure options.
Potential guest-spend opportunities
Airport and inter-show transportation | Early arrival / late departure | Stocked accommodations | Restaurant coordination | Group dining | Local concierge service | Luggage / arrival coordination
Seasonality
Tucson's summer operating pattern materially changes which experiences are easiest to sell. Visit Tucson lists average maximum temperatures of about 100°F in June, 101°F in July and 98°F in August. Tucson Food Tours correspondingly reduces summer walking exposure; the Arizona-Sonora Desert Museum extends Saturday hours to 10:00 p.m. in June–August; and Sabino Canyon Crawler sells Saturday night tours during its warm-season schedule. Early-morning desert activities, indoor culinary/cultural products, resort wellness and evening programming become more operationally sensible, while midday outdoor exposure becomes less attractive. Monsoon conditions can also disrupt outdoor plans, increasing the value of flexible cancellation terms, indoor alternatives and same-day guest communication.
6. Local Hospitality & Operator Validation
The public evidence validates several different forms of participation in the guest journey. Public materials do not disclose ancillary revenue, booking conversion, vendor commission percentages, service-fee capture, margin, profitability or the share of guests purchasing each product. The revenue scenarios in this study remain illustrative Jurny modeling assumptions, not reverse-engineered competitor performance.
7. Secondary Convenience Layer
Destination-specific experiences should lead, supported by high-frequency convenience products:
Early check-in | Late checkout | Stay extensions | Grocery pre-stock | Airport transportation | Rental-car coordination | Celebration packages | In-stay provisioning
In Tucson, these products become particularly relevant around Gem Show periods, resort stays and outdoor itineraries that require early departures or coordinated transport.
8. Revenue Opportunity Benchmark
The benchmark uses $387 of Beyond the Stay Spend per domestic overnight travel party from the 2018 Tucson & Southern Region study. Under the Beyond the Stay methodology, one guest stay is treated as one reservation / travel-party stay for modeling purposes.
100 guest stays = approximately $38,700 in spending beyond accommodations.
This represents total guest spending across the destination associated with the modeled stays. It is not operator revenue. The per-100-stay benchmark is intentionally not derived from Pima County's $3.5 billion of 2024 direct travel spending, regional visitor counts, or hotel ADR—those measures use different populations or units.
Operator Revenue Scenarios (per 100 guest stays)
Illustrative assumptions, not observed Tucson conversion or commission benchmarks. Commission and margin apply only to purchases actually facilitated through the operator, never to the full $38,700 destination-spend pool.
Scaled Opportunity
How Operators Participate
Vendor commissions — Revenue share from experiences, rentals, transportation and partners. Booking & service fees — Fees from arranging or facilitating guest purchases. Direct-margin products — Operator-controlled services such as early arrival, late departure, provisioning, celebrations and stay extensions.
Commission and margin apply only to purchases actually facilitated through the operator, never to total destination spending.
9. Market Takeaway
Beyond the Stay Ratio: 1.57x (Tucson & Southern Region proxy) — For every $1 represented by accommodation spending in the compatible 2018 regional benchmark, travelers spent approximately $1.57 beyond the stay. This is a regional proxy used because newer exact-city data do not provide a compatible per-party lodging/non-lodging split.
The strongest opportunities are rooted in experiences travelers specifically seek in Tucson:
Sonoran Gastronomy | Saguaro Desert Experiences | Mt. Lemmon Stargazing | Sabino Canyon | Premium Wellness | Gem Show Logistics
Current resort and ranch offerings already validate the accommodation channel as a place where guests discover, arrange and purchase experiences.
The opportunity is to turn the accommodation provider into the marketplace for the Tucson experience.
Sources & Modeling Notes
- Visitor Spending Benchmark: Arizona Office of Tourism / Longwoods International, Tucson & Southern Region 2018 Year-End Data Review (published 2019; 2018 travel data). Reports domestic overnight travel-party expenditures: $633 total, including $246 accommodations, $158 restaurant food & beverage, $89 destination transportation, $75 retail purchases and $65 recreation / sightseeing / entertainment.
- Current Market & Visitor Context: Arizona Office of Tourism, 2024 Tucson & Southern Region Longwoods visitor profile; Arizona Office of Tourism Travel Research Trends / Dean Runyan Associates 2024 travel-impact reporting; Arizona Office of Tourism FY25 performance summary.
- Event Impact: Visit Tucson, "Tucson Gem Show Generates $286 Million in Direct Spending for Local Economy," September 18, 2025, reporting a Seidman Research Institute at Arizona State University study.
- Experience Pricing: Tucson Food Tours; University of Arizona Mt. Lemmon SkyCenter; Sabino Canyon Crawler; Arizona-Sonora Desert Museum; Miraval Arizona.
- Local Hospitality & Operator Validation: Omni Tucson National Resort & Spa; JW Marriott Tucson Starr Pass Resort & Spa; Miraval Arizona; Tanque Verde Ranch; Tucson E-Bike Adventures.
- Seasonality Context: Visit Tucson weather/climate information checked August 19, 2026.
Beyond the Stay Ratio
Average non-accommodation guest spend ÷ average accommodation guest spend, using compatible units and populations. For the Tucson & Southern Region proxy: $387 ÷ $246 = 1.57x. Proxy selection follows the recovery hierarchy in the Beyond the Stay Research Methodology & Standards: exact market data first, compatible exact-market derivation second, closest compatible geographic proxy third, and Not Available only if all three fail. The ratio measures the relative size of traveler spending beyond accommodations. It is not a measure of hotel or STR performance, destination profitability, guest willingness to buy from an operator, or the share of spend that can be monetized.
Revenue Modeling
Facilitated-share assumptions of 10%, 20%, and 30%, and monetization assumptions of 4%, 10%, and 20%, are illustrative scenarios rather than observed Tucson conversion, commission or margin benchmarks. Total Beyond the Stay Spend is all modeled destination spending associated with the stays; Facilitated Spend is only the portion booked, referred, purchased or arranged through the hospitality operator; Operator Revenue is the fee, commission or direct margin earned on Facilitated Spend.