
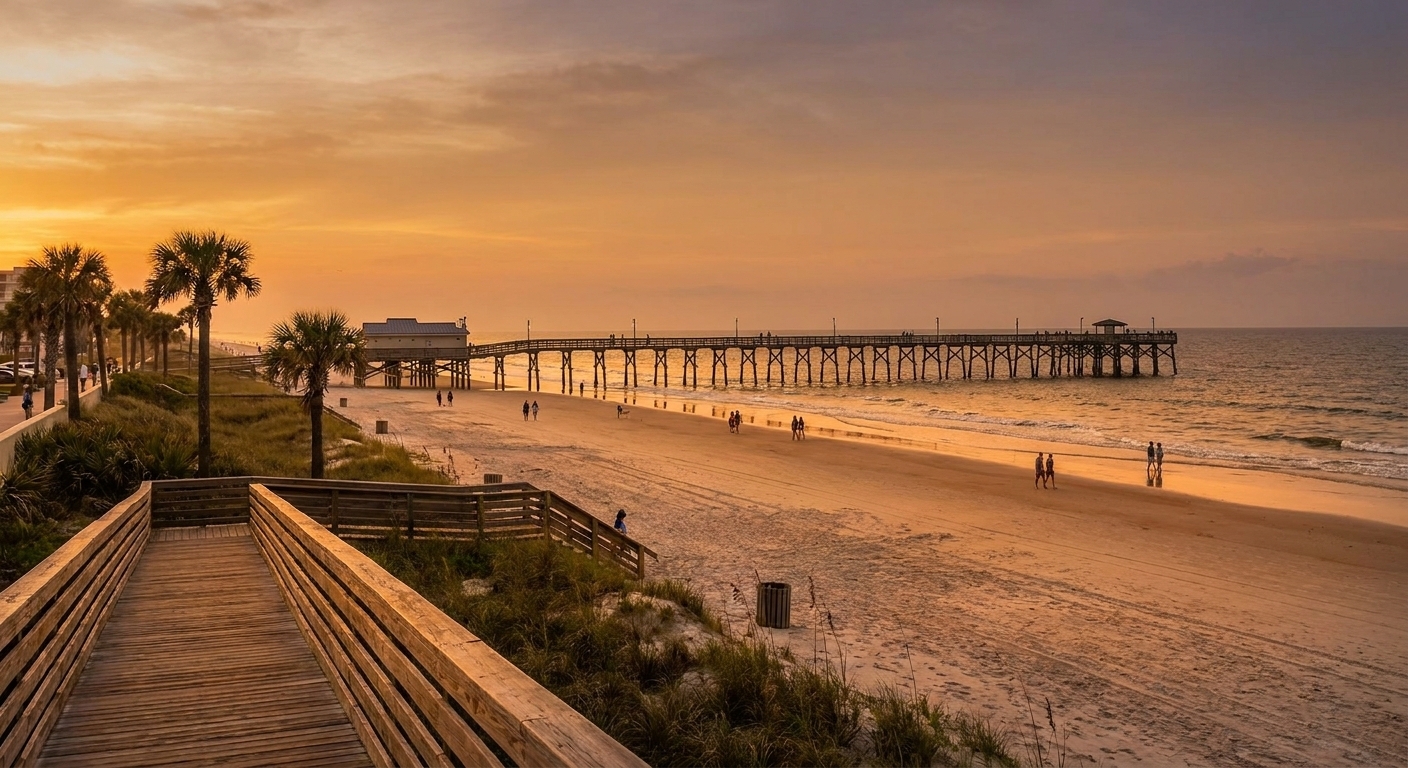
Beyond the Stay — Daytona Beach, Florida
Guest Spend Beyond the Stay · Daytona Beach, Florida
Market: Daytona Beach Area / Halifax Area
Core Submarkets: Beachside & Ocean Walk | Speedway / ONE DAYTONA | Daytona Beach Shores & Ponce Inlet
Data Vintage: Calendar Year 2025 visitor spending; current local pricing and operator offerings checked August 2026
The Daytona Beach market is defined here using the Daytona Beach Area Convention & Visitors Bureau destination geography. Its economic-impact figures are specific to the Halifax Area, a subset of Volusia County, while the visitor-profile results represent overnight visitors staying in paid accommodations.
Market Snapshot
For every $1 travelers spend on accommodations, they spend approximately $2.16 beyond the stay.
The 2025 Daytona Beach visitor study reports average total travel-party spending of $2,708 per trip for paid overnight visitors, including $856 on accommodations. The remaining $1,852 is spent beyond accommodations. Calculation: $1,852 ÷ $856 = 2.16x. The ratio uses compatible, exact-market travel-party spending inputs from the same paid-visitor population and reporting period. It is not derived from ADR or from broader Volusia County totals. Source: Daytona Beach Area CVB / Downs & St. Germain Research, 2025 Annual Visitor Tracking and Economic Impact Report.
1. Guest Spending Beyond Accommodations
Paid overnight travel parties spend an average of $1,852 beyond accommodations during a Daytona Beach trip, versus $856 on accommodations. The official paid-visitor spending profile provides the following travel-party trip mix:
Shopping is the largest individual non-lodging category, followed closely by restaurants, while activities and attractions add another $381 per travel party. Shopping, restaurants, and activities together account for $1,383 of the $1,852 Beyond the Stay Spend.
Source: Daytona Beach Area CVB / Downs & St. Germain Research, 2025 Annual Visitor Tracking and Economic Impact Report.
2. What Travelers Actually Do
Daytona Beach's paid overnight visitors combine extremely high beach participation with substantial dining, shopping, nightlife, attraction, and outdoor activity.
Paid visitor behavior therefore supports a beach + dining + shopping + entertainment guest journey rather than a beach-only ancillary strategy.
Accommodation Type Changes the Opportunity
Hotels, motels, and resorts account for 74% of paid visitors and have a typical stay of 4.4 nights, while condos and rental houses account for 20% and have a typical stay of 8.1 nights. The longer condo and rental-house stay creates additional occasions for:
Grocery provisioning | Beach gear | Equipment rentals | Dining | Transportation | Housekeeping refreshes | Multi-day experiences | Stay extensions
Paid visitor parties average 3.1 people, strengthening the fit for group-priced products such as private boat trips, fishing charters, transportation, and family experiences. These trip characteristics make pre-arrival and in-stay merchandising especially relevant for condo, vacation-rental, and resort operators.
Source: Daytona Beach Area CVB / Downs & St. Germain Research, 2025.
3. Highest-Potential Market-Specific Opportunities
Current public pricing includes approximately $31 for an adult Daytona International Speedway tour, $69 per person for a group surf lesson and $99 for a private lesson, $59 per person for a dolphin-watch boat tour, private sunset cruises from about $375, and inshore/nearshore fishing charters from $395 for the first two guests plus $30 for each additional guest. The strongest opportunities are native to Daytona's motorsports, beach, boating, fishing, dining, nightlife, and major-event demand rather than generic hospitality add-ons.
4. Opportunity by Submarket
Beachside & Ocean Walk
Best-fit opportunities:
Dining reservations | Beach equipment | Surf lessons | Bikes | Nightlife | Family attractions | Event add-ons
Market rationale:
Beachfront lodging overlaps directly with the Boardwalk/Ocean Walk visitor corridor, where beach use, restaurants, shopping, entertainment, and major gatherings can be packaged into a single guest journey. Hilton Daytona Beach Oceanfront Resort publicly includes beach-bike and boogie-board rental benefits, reinforcing the relevance of beach-oriented ancillary products in this submarket.
Speedway / ONE DAYTONA
Best-fit opportunities:
Speedway tours | Race experiences | Event transportation | Pre/post-race dining | Merchandise | Group packages
Market rationale:
Daytona International Speedway is one of the market's defining demand generators, while ONE DAYTONA directly across from the Speedway combines dining, retail, lodging, and entertainment. This creates a concentrated motorsports-commerce district where hospitality operators can merchandise experiences around event dates and race-weekend itineraries.
Daytona Beach Shores & Ponce Inlet
Best-fit opportunities:
Surf lessons | Fishing | Dolphin cruises | Bikes | Cabanas | Wellness | Nature experiences
Market rationale:
The southern beach corridor adds stronger boating, fishing, surf, wellness, and outdoor-recreation demand. The Shores Resort & Spa, Max Beach Resort, and Ambros Daytona publicly surface beach, bike, surf, cabana, spa, or wellness products, supporting a more experience-led merchandising mix.
5. Event & Seasonal Opportunity
Motorsports + Major Event Calendar
A Volusia County economic study reports $475.89 million in attendee spending across six major 2023 events held over 34 event-days: Speedweeks ($129.70M), Jeep Beach Week ($124.41M), Bike Week ($121.48M), Coke Zero Sugar 400 ($52.00M), Welcome to Rockville ($30.40M), and Biketoberfest ($17.90M). These figures are broader Volusia County event context, not inputs to the Daytona Beach per-trip ratio.
The event mix demonstrates how Daytona's guest economy can shift rapidly from leisure-beach demand to concentrated motorsports, motorcycle, music, and enthusiast-group demand. The same room or rental therefore supports different ancillary products depending on arrival date.
Highest-value event-period opportunities
Premium arrival/departure | Event transportation | Parking guidance | Restaurant reservations | Grocery and beverage provisioning | Group experiences | Bikes | Late checkout | Luggage handling | Race-weekend itineraries
Daytona is particularly well suited to date-aware merchandising. Operators can prioritize beach and water products during leisure periods, then shift toward transportation, provisioning, dining, nightlife, and event-specific experiences around major race and rally dates.
6. Local Hospitality & Operator Validation
These offerings validate that Daytona hospitality businesses are already extending their guest relationship beyond accommodations through activity discovery, rentals, wellness, resort experiences, and other in-stay services. Public materials do not establish actual commissions, conversion rates, margins, ancillary revenue, or profitability, so no assumptions are made about competitor financial performance.
7. Secondary Convenience Layer
Destination-specific experiences should lead the strategy, supported by high-frequency convenience products:
Early check-in | Late checkout | Grocery pre-stock | Beach gear | Baby gear | Housekeeping refreshes | Stocked coolers | Celebration setups | Event-weekend provisioning | Stay extensions
The 8.1-night typical stay among condo and rental-house visitors makes provisioning, refresh services, and multi-day equipment products especially relevant to the Daytona guest journey.
8. Revenue Opportunity Benchmark
Benchmark Basis: $1,852 in Beyond the Stay Spend per paid overnight travel-party stay.
This figure is directly reported from compatible Daytona Beach Area paid-visitor travel-party spending inputs: $2,708 total trip spending less $856 in accommodations. 100 guest stays = approximately $185,200 in spending beyond accommodations.
This represents total guest spending across the destination. It is not operator revenue.
Operator Revenue Scenarios (per 100 guest stays)
Illustrative assumptions only. These are not observed Daytona Beach conversion or commission benchmarks.
Scaled Opportunity
How Operators Participate
Vendor commissions — Revenue share from experiences, tours, transportation, rentals, and other partners. Booking and service fees — Fees associated with arranging or facilitating guest purchases. Direct-margin products — Operator-controlled products such as provisioning, celebrations, early arrival, late departure, housekeeping refreshes, and stay extensions.
Commission and margin apply only to purchases actually facilitated through the operator, never to total destination spending.
9. Market Takeaway
Beyond the Stay Ratio: 2.16x (Exact Daytona Beach Area paid-visitor benchmark) — For every $1 travelers spend on accommodations, approximately $2.16 is spent beyond the stay.
The strongest opportunities are rooted in experiences travelers specifically seek in Daytona Beach:
Speedway & Motorsports | Surfing | Dolphin & Sunset Cruises | Fishing | Dining & Nightlife | Beach Products | Major-Event Packages
Daytona's resorts and hotels already publicly surface beach equipment, bikes, surf instruction, wellness, cabanas, concierge-arranged activities, and other guest services, validating an active beyond-accommodation guest journey.
The opportunity is to turn the accommodation provider into the marketplace for the Daytona Beach experience.
Sources & Modeling Notes
- Visitor Spending & Behavior: Daytona Beach Area Convention & Visitors Bureau / Downs & St. Germain Research, 2025 Annual Visitor Tracking and Economic Impact Report.
- Daytona Beach Market & Submarket Context: Daytona Beach Area Convention & Visitors Bureau; Daytona International Speedway; ONE DAYTONA; Ocean Walk destination materials.
- Experience Pricing: Motorsports Hall of Fame of America / Daytona International Speedway; Pure Life Surf School; Howling Owl Sailing; Daytona Beach Charters.
- Event & Seasonal Data: Volusia County / Taylor Engineering, Recreational and Economic Value of Beach Tourism, 2025.
- Local Hospitality & Operator Validation: The Shores Resort & Spa; Hilton Daytona Beach Oceanfront Resort; Max Beach Resort; Ambros Daytona.
Beyond the Stay Ratio
Average non-accommodation paid-visitor travel-party spend ÷ average accommodation paid-visitor travel-party spend. Calculation: $1,852 ÷ $856 = 2.16x. The ratio uses exact compatible paid-visitor travel-party spending inputs for the Daytona Beach Area. It measures the relative size of traveler spending beyond accommodations and is not a measure of overall STR or hotel market performance.
Revenue Modeling
Facilitated-share assumptions of 10%, 20%, and 30%, and monetization assumptions of 4%, 10%, and 20%, are illustrative scenarios rather than observed Daytona Beach performance benchmarks.