
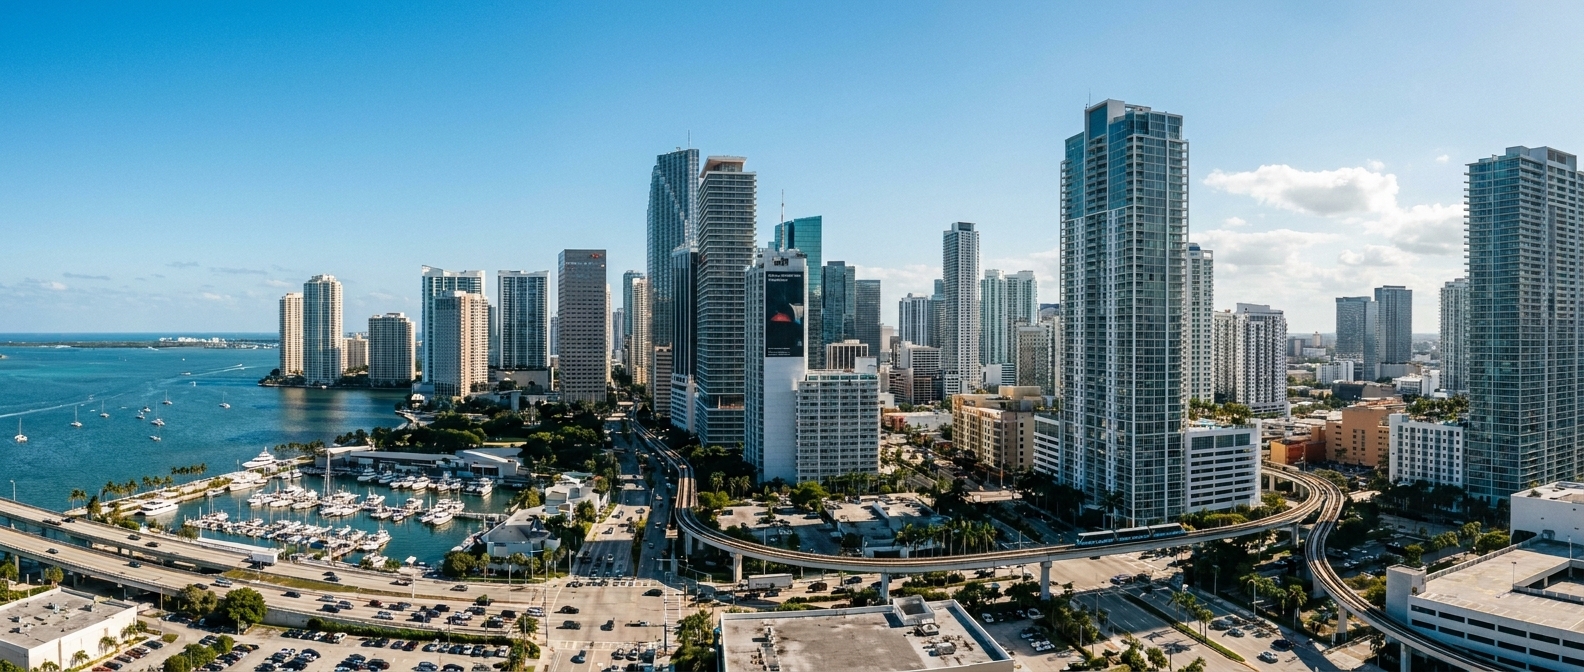
Beyond the Stay — Downtown Miami, Florida
Guest Spend Beyond the Stay · Downtown Miami, Florida
Market: Miami DDA Urban Core
Core Submarkets: Brickell | Central Business District / Bayfront | Arts & Entertainment District
Data Vintage: 2025 destination spending; 2023 overnight visitor profiles for per-stay modeling
Downtown Miami is defined here using the Miami DDA urban core, encompassing Brickell, the Central Business District, and the Arts & Entertainment District. (Source: Miami Downtown Development Authority, 2025)
Market Snapshot
For every $1 travelers spend on accommodations, they spend approximately $1.18 beyond the stay.
Miami-Dade welcomed approximately 28.3 million visitors in 2025, generating $22.7 billion in visitor spending. Lodging represented approximately $10.4 billion, leaving an estimated $12.3 billion spent beyond accommodations. Calculation: $12.3B ÷ $10.4B = 1.18x. Exact Downtown-only visitor-spending data was not publicly available. Miami-Dade is therefore used as the closest compatible geographic proxy rather than treating countywide spending as Downtown-specific. Source: Greater Miami Convention & Visitors Bureau, 2025 Tourism Results.
1. Broader Destination Spending Context
The 2025 data establishes a $12.3 billion non-lodging visitor economy across Miami-Dade, including spending on dining, shopping, transportation, entertainment, and other trip activity.
For the per-stay benchmark, the most detailed compatible overnight visitor profiles available provide the following derived Miami-Dade overnight travel-party proxy:
These figures are derived from compatible visitor-volume, party-size, and per-person expenditure data for domestic, international, and Florida-resident overnight travelers.
The spending mix is particularly relevant to Downtown hospitality operators: food and beverage is the largest individual beyond-lodging category, while transportation, shopping, and entertainment together represent substantial additional spend that can frequently be booked, referred, or facilitated during the stay.
Source: Greater Miami & Miami Beach 2023 Visitor Industry Overview, GMCVB.
2. What Travelers Actually Do
Downtown and Brickell are significant visitor destinations rather than simply lodging districts. According to GMCVB overnight visitor profiles:
Miami DDA research also identifies Downtown/Brickell among the important areas where overnight domestic, international, and Florida-resident visitors stay.
The area's major visitor-spending anchors are unusually concentrated:
Bayside Marketplace | Biscayne Bay | Kaseya Center | Pérez Art Museum Miami | Frost Science | Brickell City Centre | Waterfront Parks | Dining | Nightlife
These attractions are linked within a compact urban core, including through Miami's free Metromover system. That concentration creates a strong environment for pre-arrival and in-stay experience merchandising, rather than relying exclusively on traditional concierge referrals.
Source: Greater Miami & Miami Beach 2023 Visitor Industry Overview, GMCVB; Miami Downtown Development Authority, 2025.
3. Highest-Potential Market-Specific Opportunities
Island Queen's Millionaire's Row sightseeing cruise currently starts around $35 per adult, while Thriller Miami speedboat experiences start around $52 per adult. Frost Science adult admission currently begins around $29.95. The strongest opportunities are therefore native to the destination rather than generic hospitality add-ons.
4. Opportunity by Submarket
Brickell
Best-fit opportunities:
Premium dining reservations | Nightlife | Yacht charters | Private chefs | Luxury shopping | Wellness | Private transportation
Market rationale:
Brickell combines luxury hotels, upscale residential towers, restaurants, nightlife, premium retail, and direct waterfront access. Four Seasons Miami publicly offers or facilitates experiences including yacht charters, food and neighborhood tours, shopping, cultural attractions, and wellness, supporting the relevance of premium experience facilitation in this submarket.
Central Business District / Bayfront
Best-fit opportunities:
Sightseeing cruises | Speedboats | Kaseya Center packages | PortMiami transfers | Waterfront dining | Event transportation
Market rationale:
Bayside Marketplace, Bayfront Park, Biscayne Bay, and Kaseya Center create a dense visitor and event ecosystem. Multiple sightseeing and boating experiences depart directly from the district.
Arts & Entertainment District
Best-fit opportunities:
Museum tickets | Cultural itineraries | Family experiences | Performing arts | Dining pairings
Market rationale:
Pérez Art Museum Miami and Frost Science anchor a substantial cultural cluster within the urban core, creating natural opportunities for ticketing, itineraries, dining combinations, and family-oriented experiences.
5. Event & Seasonal Opportunity
Miami Music Week + Ultra Music Festival
The next Miami Music Week is scheduled for March 22–28, 2027, with more than 200 events, culminating in Ultra Music Festival at Bayfront Park from March 26–28, 2027.
A previous Downtown edition of Ultra attracted approximately 165,000 attendees from more than 100 countries, demonstrating the scale of concentrated visitor activity the festival can create directly inside the Downtown market.
Highest-value event-period opportunities
Premium arrival/departure | Restaurant reservations | Nightlife coordination | Local transportation | Grocery and beverage provisioning | Recovery and wellness | Late checkout | Luggage handling | Private group experiences
Downtown Miami is particularly well suited to date-aware merchandising. Guest offers should shift around major arena events, festivals, Art Week-related demand, and other periods of unusually concentrated visitor activity rather than remaining static throughout the year.
6. Local Hospitality & Operator Validation
These offerings validate that Downtown hospitality businesses are already extending their relationship with guests beyond the accommodation itself. Public materials do not establish actual commissions, conversion rates, margins, ancillary revenue, or profitability, so no assumptions are made about competitor financial performance.
7. Secondary Convenience Layer
Destination-specific experiences should lead the strategy, supported by high-frequency convenience products:
Early check-in | Late checkout | Grocery pre-stock | Airport transfers | PortMiami transfers | Luggage handling | Private chefs | Celebration setups | In-room wellness
Several local hospitality operators already publicly surface these services, confirming their relevance to the Miami guest journey.
8. Revenue Opportunity Benchmark
Benchmark Basis: $1,302 in Beyond the Stay Spend per overnight travel-party stay.
This figure is derived from compatible Miami-Dade overnight visitor profiles and should be treated as a countywide overnight proxy, not an observed Downtown Miami guest-stay figure. 100 guest stays = approximately $130,200 in spending beyond accommodations.
This represents total guest spending across the destination. It is not operator revenue.
Operator Revenue Scenarios (per 100 guest stays)
Illustrative assumptions only. These are not observed Downtown Miami conversion or commission benchmarks.
Scaled Opportunity
How Operators Participate
Vendor commissions — Revenue share from experiences, tours, transportation, rentals, and other partners. Booking and service fees — Fees associated with arranging or facilitating guest purchases. Direct-margin products — Operator-controlled products such as provisioning, celebrations, early arrival, late departure, and stay extensions.
Commission and margin apply only to purchases actually facilitated through the operator, never to total destination spending.
9. Market Takeaway
Beyond the Stay Ratio: 1.18x (Miami-Dade County proxy) — For every $1 travelers spend on accommodations, approximately $1.18 is spent beyond the stay.
The strongest opportunities are rooted in experiences travelers specifically seek in Downtown Miami:
Biscayne Bay Cruises | Speedboat Experiences | Museums & Culture | Kaseya Center Events | Brickell Dining & Nightlife | Luxury Shopping | Private Yachts
Downtown's hotels and short-term-rental managers are already publicly facilitating experiences, transportation, dining, wellness, and convenience services, validating an active beyond-accommodation guest journey.
The opportunity is to turn the accommodation provider into the marketplace for the Downtown Miami experience.
Sources & Modeling Notes
- Visitor Spending & Behavior: Greater Miami Convention & Visitors Bureau, 2025 Tourism Results; Greater Miami & Miami Beach 2023 Visitor Industry Overview.
- Downtown Market & Submarket Context: Miami Downtown Development Authority, 2025 research.
- Experience Pricing: Island Queen Cruises, Thriller Miami, Frost Science.
- Event & Seasonal Data: Greater Miami Convention & Visitors Bureau, Ultra Music Festival.
- Local Hospitality & Operator Validation: Four Seasons Hotel Miami, InterContinental Miami, Ilios Rentals, Apex Hospitality Rentals.
Beyond the Stay Ratio
Miami-Dade visitor spending excluding accommodations ÷ accommodation visitor spending. Calculation: $12.3B ÷ $10.4B = 1.18x. The ratio is a Miami-Dade geographic proxy and measures the relative size of visitor spending beyond accommodations. It is not a measure of overall STR or hotel market performance.
Revenue Modeling
Facilitated-share assumptions of 10%, 20%, and 30%, and monetization assumptions of 4%, 10%, and 20%, are illustrative scenarios rather than observed Downtown Miami performance benchmarks.