
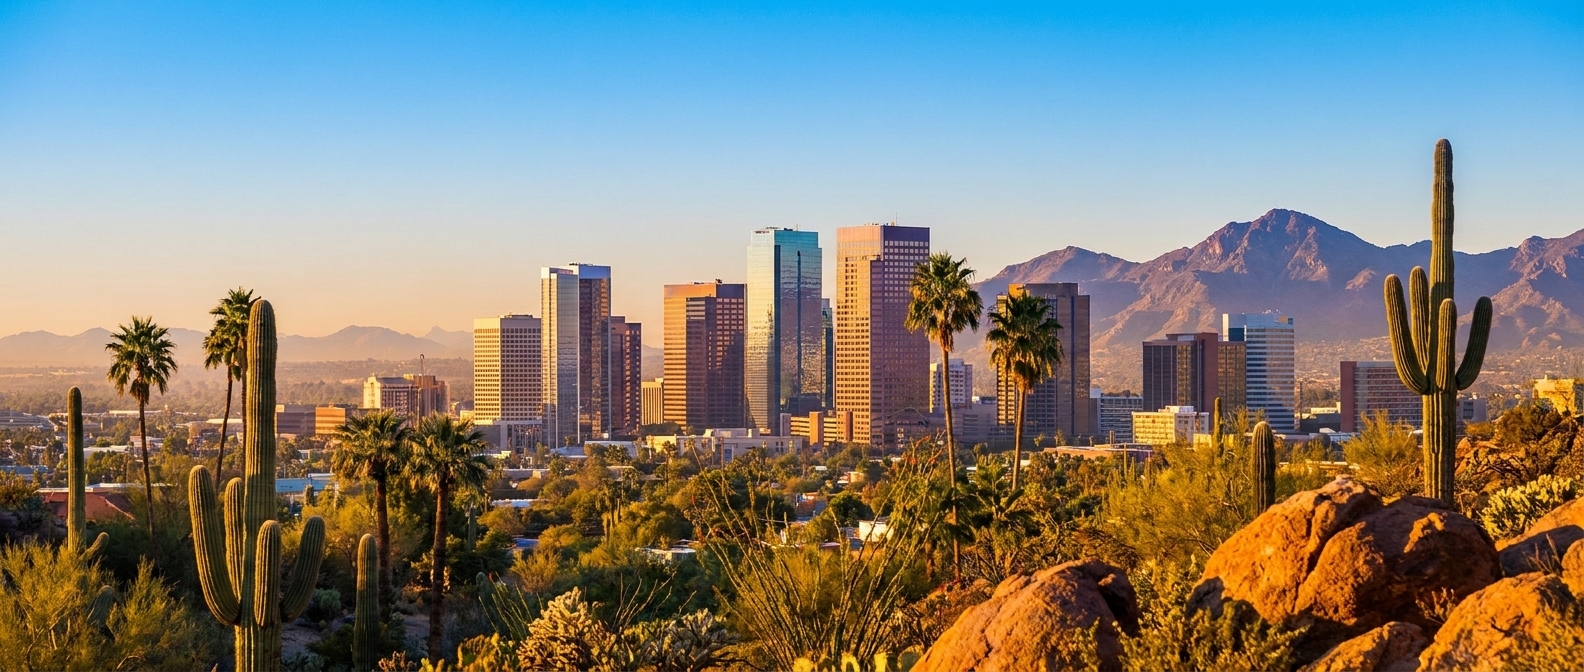
Beyond the Stay — Phoenix, Arizona
Guest Spend Beyond the Stay · Phoenix, Arizona
Market: City of Phoenix, Arizona
Core Submarkets: Downtown Phoenix / Roosevelt Row | Biltmore / Central Phoenix | North Phoenix / Desert Ridge
Data Vintage: Phoenix hotel impact: 12 months ending August 2025 | City visitor impact: 2024 | Phoenix-metro visitor profile: 2023
Market Snapshot
For every $1 represented by hotel sales in Phoenix, hotel guests spend an estimated $1.49 beyond hotel sales.
Oxford Economics' latest City of Phoenix hotel study reports $4.137 billion in hotel-guest spending at hotels, local businesses and on transportation, compared with $1.660 billion in hotel sales for the 12 months ending August 2025. Hotel sales are defined as revenue plus certain taxes. Estimated Beyond the Stay Spend: $4.137B total hotel-guest spending − $1.660B hotel sales = $2.477B. Estimated Beyond the Stay Ratio: $2.477B ÷ $1.660B = 1.49x. This is a Phoenix-specific estimate, not a geographic proxy. The principal limitation is that hotel sales are broader than pure room-only accommodation revenue. Because the denominator may include taxes and some non-room hotel revenue, 1.49x should be treated as a conservative approximation of Phoenix's accommodation-only Beyond the Stay Ratio. Phoenix's overall visitor economy reinforces the scale of the opportunity: the city welcomed 20.8 million visitors who spent approximately $5.0 billion in 2024.
1. Guest Spending Beyond Accommodations
The Oxford Economics hotel study provides the strongest current exact-city view of spending attached to Phoenix overnight hotel demand.
Oxford Economics reports 168 Phoenix hotel properties, 25,164 guest rooms and approximately 6.5 million sold room nights in the study period.
The study does not publish a detailed Phoenix-only ancillary-spending category table, so restaurant, retail, transportation and recreation dollars are not artificially allocated. It does establish that hotel guests' spending extends beyond hotels into local businesses and transportation, with AHLA specifically highlighting restaurants, retail, arts and entertainment among the sectors supported by visitor spending.
Estimated Per-Stay View
Visit Phoenix's currently published Phoenix-metro visitor profile reports an average 3.0 overnights in Phoenix and an average 2.7-person travel party. Using the 3.0-night figure only to translate the exact-city room-night data into a directional hotel-stay benchmark:
This per-stay view is an estimate, because the 3.0-night trip characteristic comes from the 2023 Phoenix-metro visitor profile while the spending data cover City of Phoenix hotels through August 2025. It is not used to create the 1.49x ratio; that ratio comes entirely from the exact-city 2025 hotel-spending dataset.
2. What Travelers Actually Do
The latest visitor profile currently published by Visit Phoenix identifies the five leading activities among Phoenix overnight visitors as shopping, sightseeing, attending a celebration, going to a bar/nightclub and swimming. The profile also reports 3.0 Phoenix overnights and a 2.7-person travel party.
Those behaviors point toward several distinct spending ecosystems.
Urban dining, nightlife and culture
Downtown Phoenix combines restaurants, nightlife, arts, sports and convention demand. More than $5 billion in downtown investment has added or improved hotels, restaurants, entertainment, convention facilities and other visitor infrastructure.
Sonoran Desert recreation
Phoenix's outdoor proposition is directly bookable. South Mountain Park and Preserve spans more than 16,000 acres, while commercial guides currently sell Phoenix desert hiking experiences through the preserve.
Resort recreation and wellness
The Biltmore and Desert Ridge areas support golf, spa, pools, pickleball and premium dining, creating a higher-ticket leisure layer beyond the urban core.
Cultural attractions
North Phoenix's Musical Instrument Museum provides a significant year-round indoor experience, with current general admission of $20.
3. Highest-Potential Market-Specific Opportunities
Phoenix's strongest mix combines high-frequency urban purchases such as dining and nightlife with higher-ticket desert, wellness and recreation products.
4. Opportunity by Submarket
Downtown Phoenix / Roosevelt Row
Best-fit opportunities:
Culinary experiences | Restaurant reservations | Cocktails & nightlife | Sports experiences | Cultural tickets | Event transportation
Market rationale:
Downtown concentrates the Phoenix Convention Center, hotels, dining, entertainment and cultural infrastructure, while Roosevelt Row adds a walkable arts, restaurant and nightlife environment. The area's multibillion-dollar investment cycle has strengthened its role as both an event district and leisure destination.
Biltmore / Central Phoenix
Best-fit opportunities:
Spa & wellness | Golf | Premium dining | Private chefs | Celebration services | Hiking coordination | Private transportation
Market rationale:
The Biltmore area carries a more resort-oriented guest proposition. Arizona Biltmore currently surfaces a full-service spa, two golf courses, seven dining outlets and concierge services, supporting premium recreation and wellness purchases.
North Phoenix / Desert Ridge
Best-fit opportunities:
Golf | Pickleball | Spa | Pool & cabana experiences | MIM access | Ballooning | Family recreation
Market rationale:
JW Marriott Phoenix Desert Ridge combines two 18-hole championship golf courses, 17 lighted pickleball courts, spa and extensive aquatic recreation; MIM provides a nearby cultural anchor.
5. Event-Driven Opportunity
Major Downtown Events
Phoenix hosted its first NCAA Women's Final Four from April 2–5, 2026. The national semifinals and championship each drew 15,856 spectators, while games and associated fan events generated 360,823 total attendances across downtown Phoenix during championship week.
That type of compressed event demand creates immediate opportunities around airport transfers, restaurant reservations, group transportation, provisioning, nightlife, experience bookings and late checkout.
Cactus League Spring Training
The broader Valley's Cactus League attracted 1,753,849 spectators across 237 games in 2026, up 3.4% from 2025 and the league's strongest total since 2018. This is a Greater Phoenix / Valley-wide demand driver, not a City of Phoenix-only attendance figure.
For accommodation operators, spring training supports multi-day combinations of baseball, dining, transportation, golf, pools and nightlife rather than a single event transaction.
Summer Shift
Phoenix's product strategy should change with the season. Guided South Mountain operators use earlier departures to manage hotter conditions, while resorts emphasize pools, spa and wellness offerings.
The strongest summer layer therefore shifts toward early-morning desert recreation, spa and wellness, aquatic experiences, cultural attractions and in-home services.
6. Local Operator Validation
Public materials establish which products are surfaced to guests; they do not establish operator commissions, ancillary revenue, conversion rates, margins or profitability.
These offerings demonstrate that Phoenix hospitality businesses are already extending the guest relationship into food, wellness, recreation, transportation and convenience services.
7. Secondary Convenience Layer
Destination-specific experiences should lead the strategy, supported by a convenience layer of:
Airport/private transportation | Grocery pre-stock | Private chefs | In-home massage | Pool-related services | Celebration setup | Baby gear | Early check-in | Late checkout | Stay extensions
Phoenix operator offerings provide particularly clear validation for provisioning, private chefs, wellness, transportation and celebration services.
8. Revenue Opportunity Benchmark
For modeling purposes, the estimated Phoenix hotel-stay baseline is approximately $1,151 in Beyond the Stay Spend per stay.
This directional estimate applies the currently published 3.0-night Phoenix average to the exact-city estimate of approximately $384 in Beyond the Stay Spend per sold room night. 100 guest stays = approximately $115,100 in spending beyond accommodations.
This represents estimated guest spending across the destination. It is not operator revenue.
Operator Revenue Scenarios (per 100 guest stays)
Facilitated-share assumptions of 10%, 20% and 30% and monetization assumptions of 4%, 10% and 20% are illustrative Beyond the Stay scenarios, not observed Phoenix conversion or commission benchmarks.
Scaled Opportunity
How Operators Participate
Vendor commissions can come from experiences, recreation, transportation and other partners. Booking or service fees can apply when an operator arranges guest purchases or itinerary services. Direct-margin products can include provisioning, celebrations, early arrival, late departure and stay extensions. Commission and margin apply only to purchases actually facilitated through the hospitality operator, never to total destination spending.
Benchmark note: The $1,151 figure is a directional hotel-stay estimate, not an observed Phoenix STR or vacation-rental travel-party spend figure. It combines exact-city 2025 hotel spending with the latest Phoenix-metro average trip length currently published by Visit Phoenix. The underlying 1.49x ratio itself does not rely on that cross-vintage conversion.
9. Market Takeaway
Beyond the Stay Ratio: ~1.49x — Estimated. For every $1 represented by hotel sales in Phoenix, hotel guests spend an estimated $1.49 beyond hotel sales. The calculation is based on exact City of Phoenix data showing $4.137 billion in hotel-guest spending versus $1.660 billion in hotel sales.
City of Phoenix visitor spending, 2024: $5.0B
The strongest opportunities are rooted in experiences that fit Phoenix specifically:
Downtown culinary & nightlife | Sonoran Desert adventures | Hot-air ballooning | Golf & pickleball | Spa & wellness | Arts & culture | Sports & event experiences
Phoenix's opportunity is unusually diversified. Downtown provides frequent restaurant, nightlife, culture and event transactions; the Biltmore and Desert Ridge environments support premium wellness and recreation; and the surrounding Sonoran Desert supports higher-ticket guided experiences.
Local vacation-rental and resort offerings already demonstrate that guests are being offered chefs, provisioning, transportation, wellness, golf and recreation through their accommodation relationship.
The opportunity is to turn the accommodation provider into the marketplace for the destination experience.
Sources & Modeling Notes
- Phoenix Hotel Spending & Ratio: Oxford Economics / American Hotel & Lodging Association, Economic Impact of the Hotel Industry: City of Phoenix, December 2025; estimates cover the 12 months ending August 2025. The study reports $4.137B in hotel-guest spending, $1.660B in hotel-operation business sales and 6.459M sold room nights.
- Phoenix Visitor Economy: Visit Phoenix / Tourism Economics, 2024 Economic Impact of Visitors to Phoenix: 20.8M visitors and approximately $5.0B in direct visitor spending.
- Traveler Profile: Visit Phoenix, Phoenix-Metro Visitor Profile based on Longwoods International 2023 research: 3.0 average Phoenix overnights, 2.7-person travel party and leading overnight-visitor activities.
- Experience Pricing: Current public prices from Taste It Tours, 360 Adventures, Hot Air Expeditions, Arizona Biltmore and the Musical Instrument Museum.
- Event Data: City of Phoenix reporting for the 2026 NCAA Women's Final Four and Cactus League reporting for 2026 spring-training attendance.
- Local Hospitality Validation: Current public offerings from AvantStay, Arizona Biltmore and JW Marriott Phoenix Desert Ridge.
Beyond the Stay Ratio
$4.1372B total hotel-guest spending − $1.6599B hotel sales = $2.4773B estimated Beyond the Stay Spend. $2.4773B ÷ $1.6599B = 1.49x. The ratio is explicitly labeled estimated because Oxford Economics' hotel-sales denominator represents revenue plus certain taxes rather than pure room-only accommodation spend. It therefore provides a strong Phoenix-specific directional benchmark but should not be interpreted as a precise room-revenue ratio.
Study Framework
Definitions, recovery rules and fixed revenue-model assumptions follow the Beyond the Stay Research Methodology & Standards and Master Market Study Template. Amelia Island is used solely as the presentation and quality benchmark.